Dynamic Time Warping (DTW) is a fabulous tool that I use in various applications with students in R2P2 Lab (https://uniter2p2.fr/ for ballistocardiography, pressure measures, gait analysis...).
Quoting wikipedia:
"In time series analysis, dynamic time warping (DTW) is an algorithm for measuring similarity between two temporal sequences which may vary in time or speed. For instance, similarities in walking patterns could be detected using DTW, even if one person was walking faster than the other, or if there were accelerations and decelerations during the course of an observation."
In redCV we use a basic DTW. The objective is to find a mapping between all points of x and y series. In the first step, we will find out the distance between all pair of points in the two signals. Then, in order to create a mapping between the two signals, we need to create a path. The path should start at (0,0) and want to reach (M,N) where (M, N) are the lengths of the two signals. To do this, we thus build a matrix similar to the distance matrix. This matrix would contain the minimum distances to reach a specific point when starting from (0,0). DTW value corresponds to (M,N) sum value.
Results are pretty good for 1-D series.

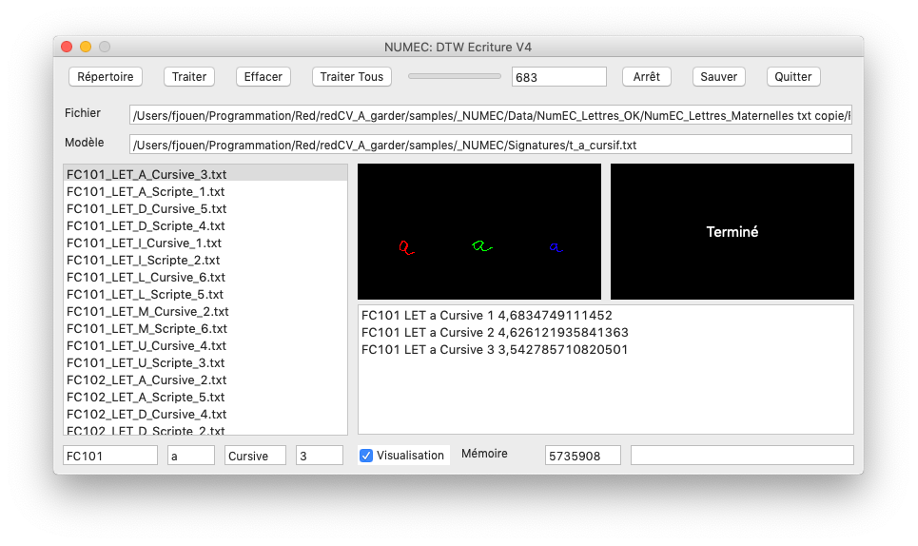
Now imagine we must compare characters to measure similarity between shapes such as hand-writing productions for example: DTW gives us a direct measurement of the distance between characters.
If the characters are identical, DTW equals to 0 as illustrated here:

Now consider b and d characters that are close but different by orientation. In this case, DTW value increases.

These techniques were successfully used for a scientific project comparing cursive vs. script writing learning in French and Canadian children. Data were recorded with a Wacom tablet and then processed with Red and RedCV. Each child’s production was compared to a template, and DTW was calculated allowing to reduce the complexity to a sole value, and then allowing statistics on data.